FTSE 100 & DAX 90: Top Investor Voting vs. Proxy Advisory Analysis
Sandro Barbato
Introduction
This cross-market comparison has been developed focusing on the United Kingdom and Germany, arguably two of the most sophisticated capital markets in Europe. Distinctions in specific voting guidelines and corporate governance expectations between these jurisdictions are not viewed as compromising the validity of this high-level statistical comparison.
To facilitate a robust dataset for meaningful analysis, the FTSE 100 was utilized for the United Kingdom, while a synthetic “DAX 90“ -comprising an aggregation of the DAX 40 and MDAX 50- was established to provide a comparable German peer group.
Therefore, we examined the voting activity of 15 top-tier global investors across 85 FTSE 100 and 82 DAX 90 constituents throughout 2025, with a total volume of 24,535 and 19,414 recorded investor votes, respectively. It is considered a substantial basis for evaluating voting behaviour against Institutional Shareholder Services (“ISS”) and Glass Lewis (“GL”) recommendations, the two preeminent global proxy advisory firms.
Key Findings
- Within the FTSE 100 and DAX 90 indices, alignment with positive ISS recommendations appears consistently high. In the FTSE 100, twelve investors exhibit an alignment of 99% or greater, whereas ten investors attain this threshold within the DAX 90. The remaining institutional investors nevertheless maintain substantial alignment rates, ranging between 91.7% and 98.7%.
- The negative ISS recommendations reveal a starkly different landscape. The peak alignment in the FTSE 100 reaches 96%, and 88.3% in the DAX 90. Furthermore, alignment rates fluctuate significantly, descending to as low as 19.1% in the FTSE 100 and 14.2% in the DAX 90.
- Regarding positive GL recommendations, the degree of alignment across both the FTSE 100 and the DAX 90 tends to be lower. While ten investors in the FTSE 100 maintain an alignment of 99% or greater, only three investors reach this level within the DAX 90.
- Concluding with negative GL recommendations, the highest alignment within the FTSE 100 stands at 72.2%, with a notable decrease to a floor of 17.7%. In contrast, the DAX 90 exhibits a higher peak alignment of 86.3%, while the minimum alignment observed is 29%.
Deconstructing the “Blind Following” Narrative
The high degree of alignment with positive proxy advisory recommendations suggests that proxy advisory mirrors an established consensus on core corporate governance topics.
In contrast, the lower alignment with negative recommendations indicates that investors’ internal voting guidelines are less rigid and thus frequently support agenda items even when ISS and/or Glass Lewis recommend against them. This highlights a distinct misalignment between the standardized recommendations of proxy advisors and the independent stewardship policies of individual institutional investors.
The (Secret) “Decision-Maker” Narrative
The discourse surrounding proxy advisory firms frequently invokes the narrative of a “secret decision-maker,” a theme that remains a staple of both professional discussions and media coverage.
While it cannot be entirely discounted that certain individual AGMs, if viewed in isolation, might suggest that proxy advice served as the primary catalyst for a voting outcome, our empirical data appears to challenge this assumption.
From Ex-Post Observation to Ex-Ante Strategy
ISS and Glass Lewis recommendations are strong statistical indicators, but their review is essentially passive and retrospective.
While our clients already benefit from a proprietary database granular enough to track & analyse specific agenda item types, achieving success at an AGM requires moving beyond reactive damage control. By shifting the focus to a proactive analysis of individual investor guidelines, companies can bridge the ‘governance gap’ long before a proxy advisory analysis is even published.
Ultimately, a positive outcome is determined by aligning corporate decisions and the meeting agenda with investors’ expectations well in advance of the shareholder meeting.
Alignments & Divergences with ISS & Glass Lewis
Statistics: FTSE 100 & DAX 90 vs. ISS & Glass Lewis
Comparison of the Peers: FTSE 100 & DAX 90
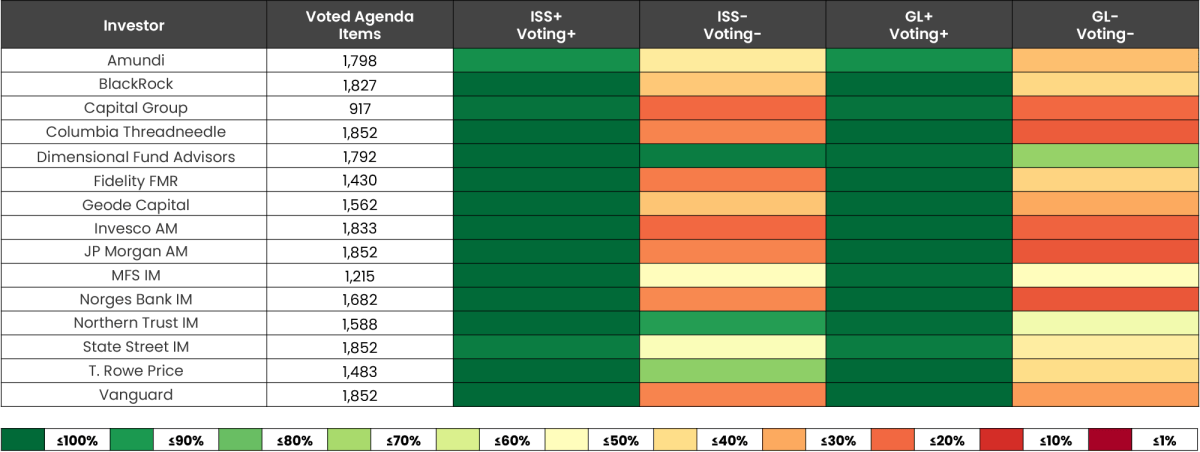
The following dataset details the voting activity of the fifteen selected institutional investors alongside their disclosed utilization of ISS and/or Glass Lewis (“GL”) advisory services. This data serves as the empirical foundation for the subsequent analysis of alignment or divergence with the proxy advisory recommendations.
- Sample Size and Investor Profile: The dataset encompasses the aggregate number of agenda items voted upon by each constituent investor across both indices. For instance, Amundi recorded votes on 1,798 items within the FTSE 100 and 1,570 within the DAX 90. It appears that investors utilizing index-tracking strategies naturally exhibit a higher volume of voted agenda items. Conversely, more concentrated or selective investors, characterized by a narrower scope of investee companies, demonstrate a correspondingly lower number of voted items.
- Weighting and Distribution: Within this peer group, the total volume of votes amounts to 43,949. The FTSE 100 accounts for 24,535 of these votes (55.8%), while the DAX 90 represents 19,414 (44.2%).
- Market Variance: The higher volume observed within the FTSE 100 appears to be driven by a greater aggregate number of votable agenda items per company in the UK market, rather than being a result of investor selection. As delineated in the “Methodology & Database” section, the analysis encompasses 85 of the FTSE 100 and 82 of the DAX 90 companies, reflecting a balanced corporate peer group despite the variance in absolute vote counts.

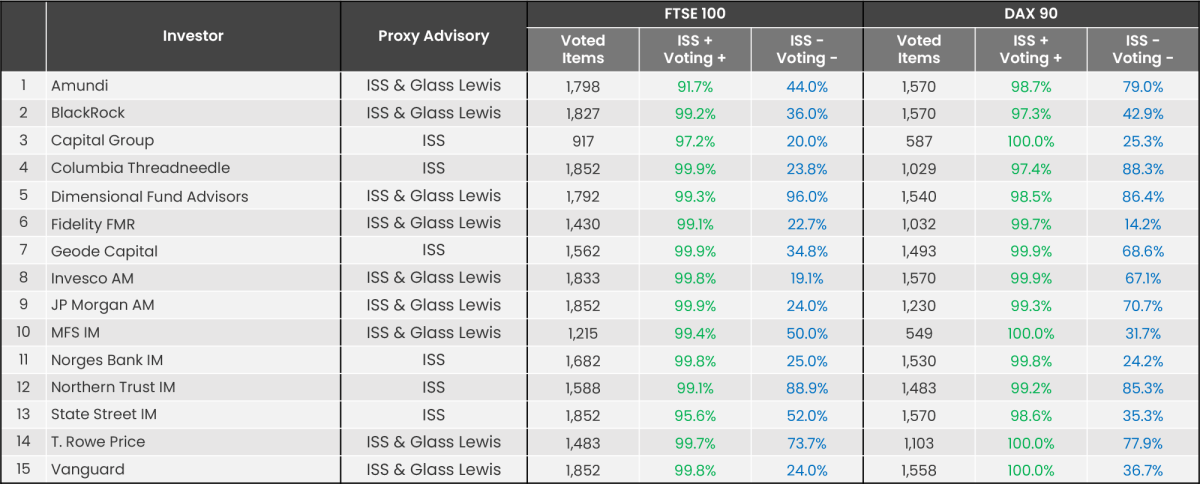
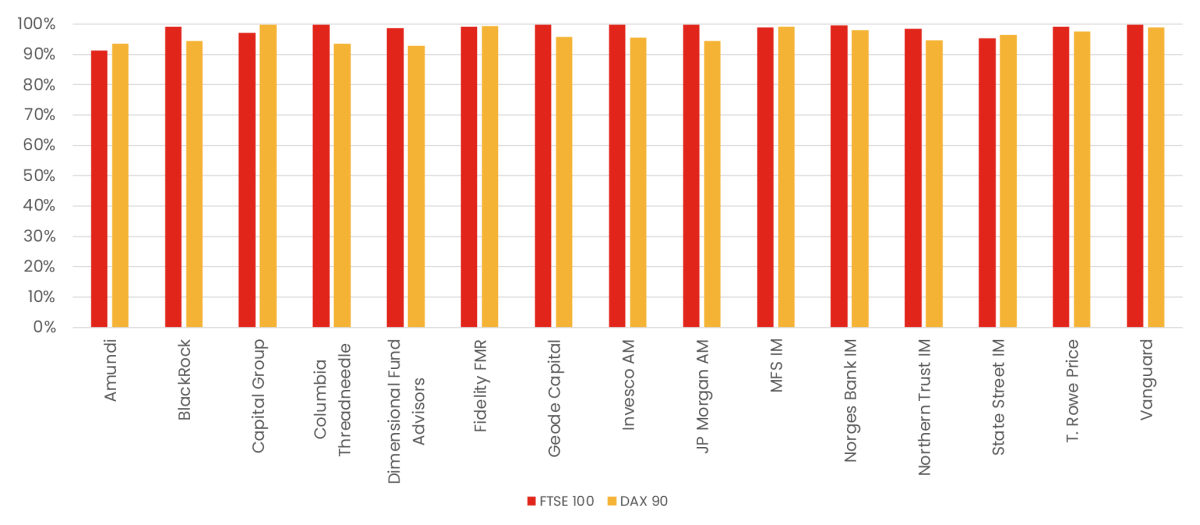
ISS Recommendations Alignment: FTSE 100 & DAX 90
Further illustrations can be found on the heatmaps and bar charts below.
ISS + = Voting +
This dataset shows the percentage of “For” votes cast for agenda items that received a positive ISS recommendation. Any deviation from 100% occurs when an investor votes against an item despite a supportive ISS recommendation.
- High Alignment: Alignment with “For” recommendations remains exceptionally high across both markets; indeed, the degree of alignment exceeds 99% in twelve instances within the FTSE 100 and in ten cases within the DAX 90.
Market Comparison: The unweighted average alignment for positive recommendations is slightly higher in the DAX 90 (~98.8%) than in the FTSE 100 (~98.1%). - Regional Trend: In 11 out of 15 cases, investors show higher alignment with ISS “For” recommendations in the DAX 90 compared to the FTSE 100.
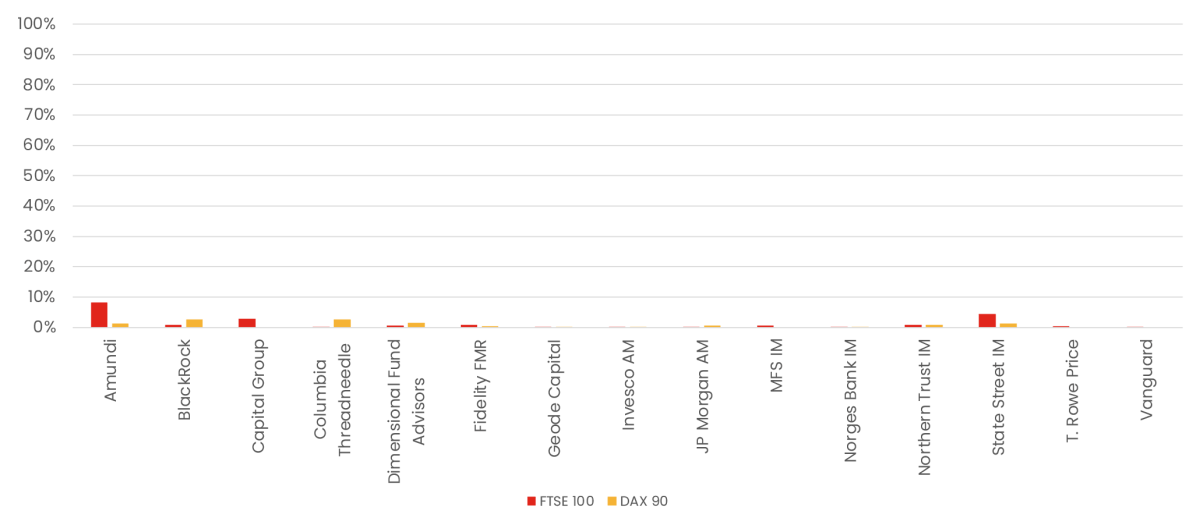
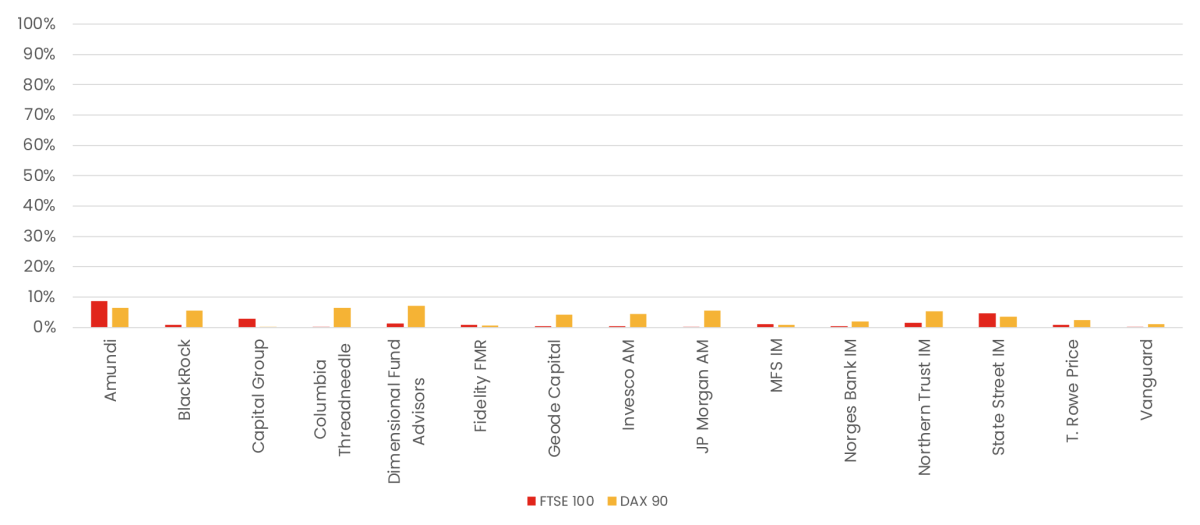
ISS – = Voting –
This dataset shows the percentage of “Against” votes cast for agenda items that received a negative ISS recommendation. Any deviation from 100% occurs when an investor votes for an item despite a negative ISS recommendation.
- Low Alignment: Alignment with “Against” recommendations remains low across both markets.
Market Comparison: In contrast to the consensus observed regarding positive recommendations, the unweighted average alignment for negative recommendations decreases substantially to approximately 41.5% in the FTSE 100 and 51.5% in the DAX 90. Furthermore, individual alignment levels exhibit significant volatility, descending to a floor of 19.1% within the FTSE 100 and 14.2% within the DAX 90. - Regional Trend: In 10 out of 15 cases, investors demonstrate a relatively stricter adherence to ISS “Against” recommendations in the German market than in the UK.
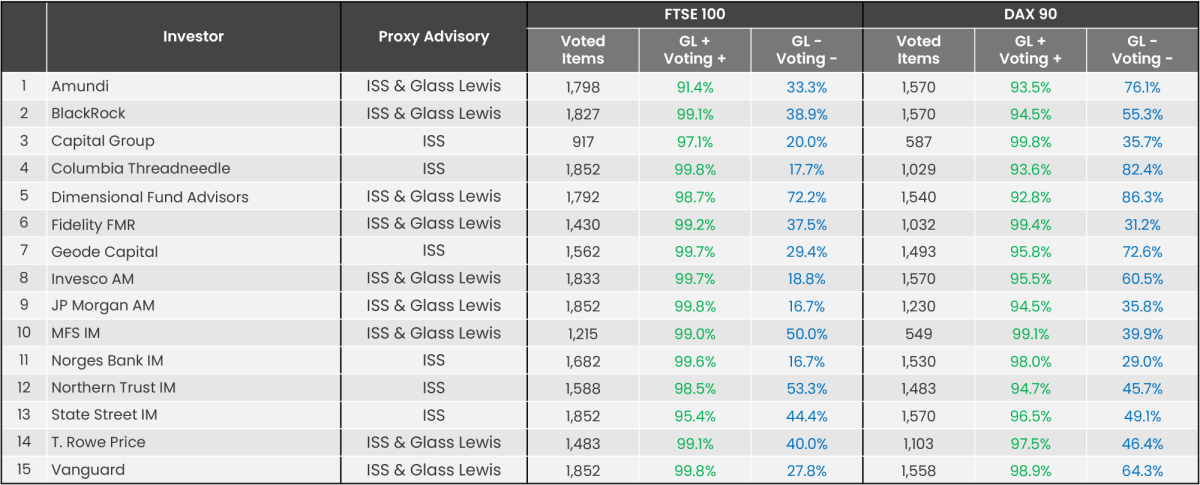
Glass Lewis (“GL”) Recommendations Alignment: FTSE 100 & DAX 90
Further illustrations can be found on the heatmaps and bar charts below.
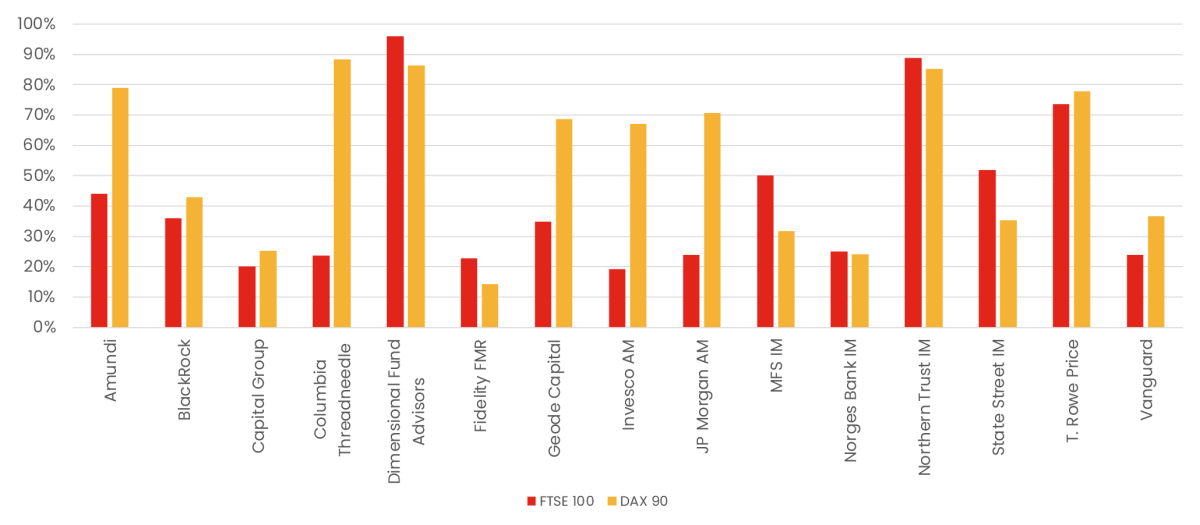
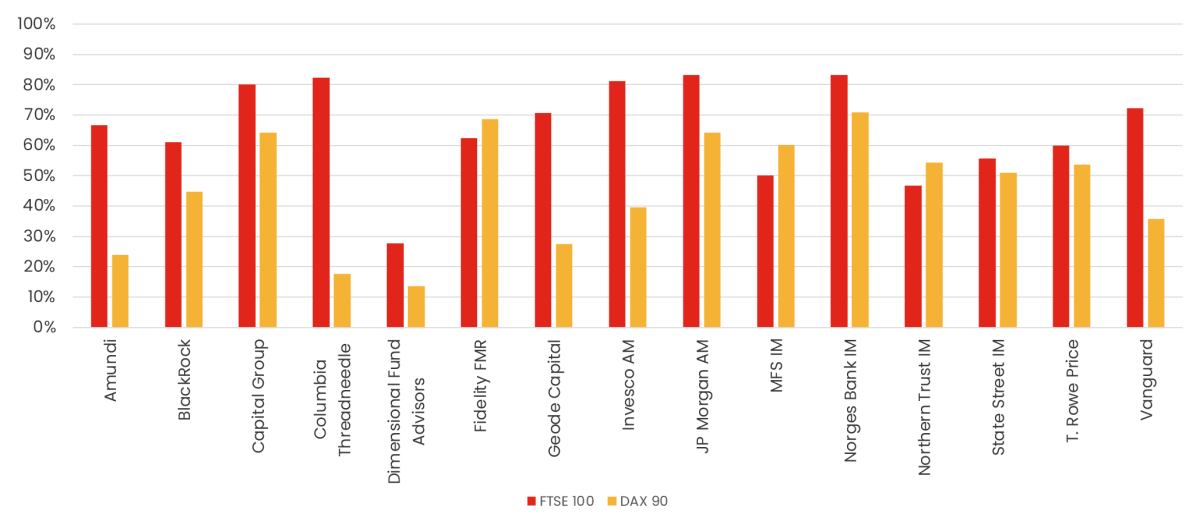
GL + = Voting +
This dataset shows the percentage of “For” votes cast for agenda items that received a positive GL recommendation. Any deviation from 100% occurs when an investor votes against an item despite a supportive GL recommendation.
Strong Alignment : Similar to ISS, alignment with positive GL recommendations remains exceptionally high, with nearly all investors exceeding 90% across both markets.
- Market Comparison: The unweighted average alignment for positive recommendations is slightly higher in the FTSE 100 (~98.3%) compared to the DAX 90 (~96.3%).
- Regional Trend: 10 of 15 investors show a higher alignment with GL “For” recommendations in the FTSE 100 compared to the DAX 90.
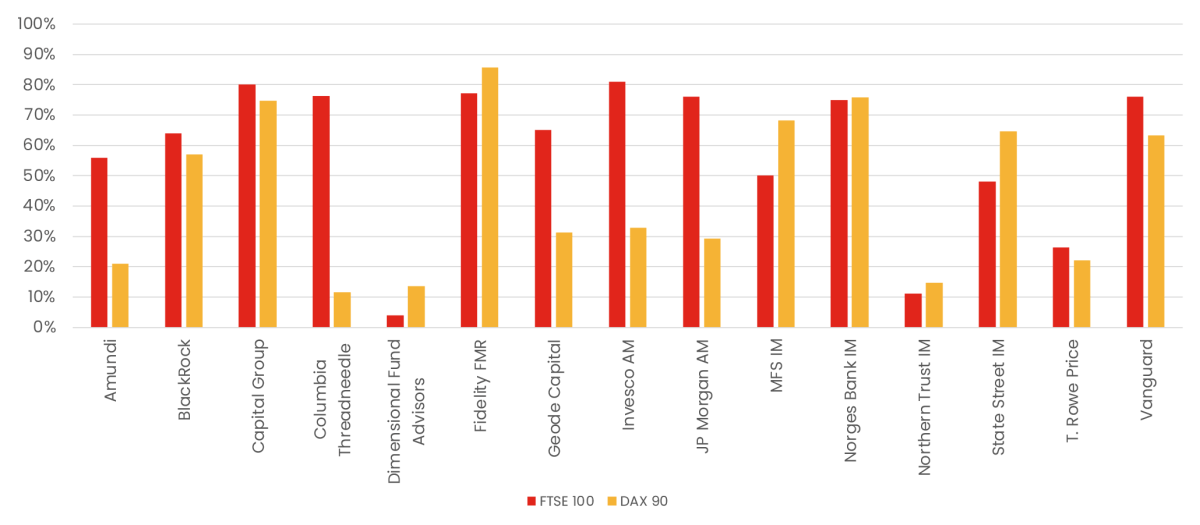
GL – = Voting –
This dataset shows the percentage of “Against” votes cast for agenda items that received a negative GL recommendation. Any deviation from 100% occurs when an investor votes against an item despite a supportive GL recommendation.
- Low Alignment: Alignment with “Against” recommendations is notably low across both markets.
- Significant Drop in Alignment: Consistent with the ISS data, the unweighted average alignment for negative recommendations is much lower than for positive ones, at approximately 34.1% in the FTSE 100 and 52.2% in the DAX 90. Furthermore, individual alignment levels exhibit significant volatility, descending to a floor of 16.7% within the FTSE 100 and 29% within the DAX 90.
- Regional Trend: 12 of 15 investors demonstrate a stricter adherence to GL “Against” recommendations in the German market than in the UK.
Heatmaps: Alignments & Divergences with ISS & Glass Lewis
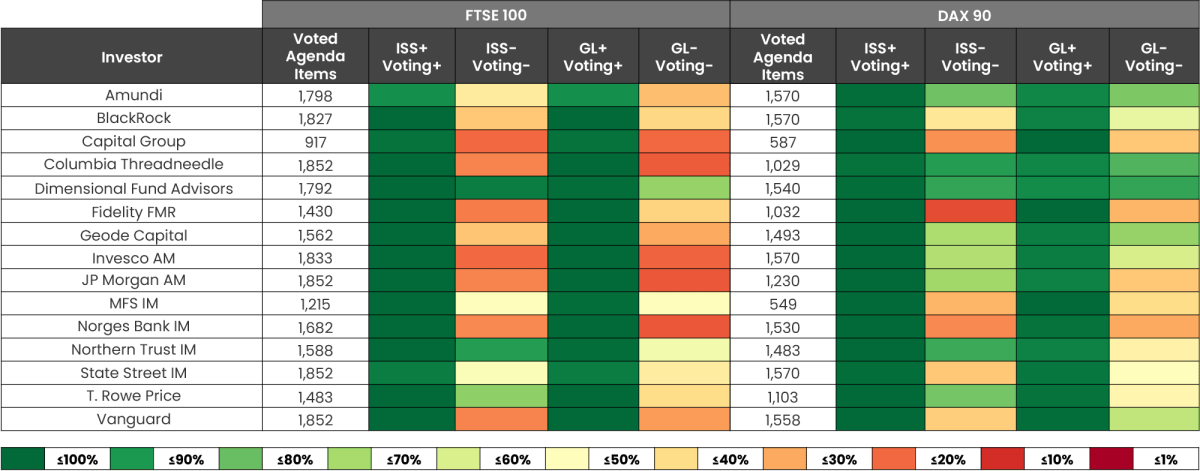
Heatmap- FTSE 100 Alignment vs. DAX 90 Alignment
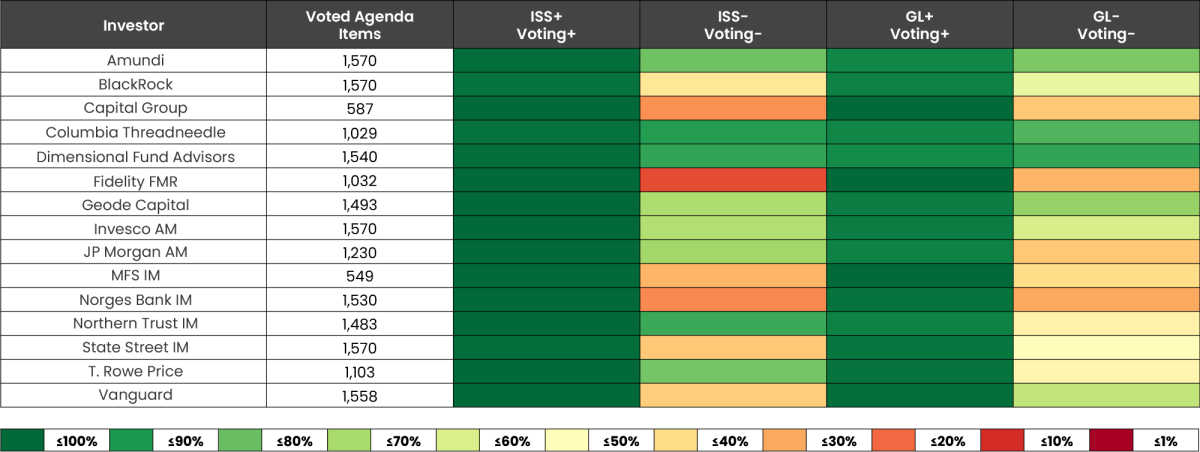
Heatmap- DAX 90 Alignment
Heatmap- FTSE 100 Alignment
Bar Charts: Alignments & Divergences with ISS & Glass Lewis


About Correlation, Causality & Possible Influencing Factors
Interpreting Congruence: Why High Alignment Is Not Proof of Causation
According to a paper by Robert Matthews in 2000 titled “Storks Deliver Babies (p=0.008)”, a highly statistically significant correlation exists between stork populations & human birth rates across Europe.
As the paper showed that a high correlation does not inherently imply causality, the author noted: “While storks may not deliver babies, unthinking interpretation of correlation and p-values can certainly deliver unreliable conclusions.”
Possible Factors Influencing Voting Alignments
- Shared Best Practices: Both investors and proxy advisors frequently operate from the same global governance playbooks. Frameworks established by organizations such as the ICGN, UN PRI, and the OECD, alongside national Corporate Governance Codes, create a common baseline. Consequently, high alignments with positive proxy advisory recommendations might just reflect a shared adherence.
- Feedback Loops: ISS and Glass Lewis conduct comprehensive annual policy surveys and regular client consultations to ensure their benchmarks remain aligned. By considering also this direct input for their guidelines, there might be a certain self-reinforcing cycle.
- Routine Consensus: A certain portion of AGM agendas consist of “routine” and rarely controversial items. In these cases, there is a natural market-wide overlap in positive recommendation & voting, which mathematically inflates alignment percentages.
- Common Perspectives: The high degree of alignment with positive recommendations suggests that proxy advisors mirror an established consensus on basic corporate governance best practices.
Possible Factor Influencing Voting Divergences
- Diverging Perspectives: In contrast, the lower alignment with negative recommendations might indicate that investors’ internal voting guidelines are less rigid and thus frequently support agenda items even when ISS and/or Glass Lewis recommend against them. Consequently, this highlights a clear misalignment between the recommendations of proxy advisors and the independent views and voting policies of individual institutional investors.
Methodology & Database
Methodology Market Peer Comparison & Index Selection
- Our study examines 15 of the largest international institutional investors, selected based on average investment size and strategic shareholder structures.
- The underlying voting behavior has been curated directly from the investors’ respective public disclosure platforms. This approach ensures that the dataset reflects the official, ex-post records of their stewardship activities, providing a transparent and verifiable basis for our analysis.
- Furthermore, the analysis utilizes original ISS and Glass Lewis recommendation data, deliberately avoiding datasets reconstructed ex-post from the disclosed voting records of investors assumed to have outsourced their voting decisions. Our direct access to primary advisory data ensures that the dataset remains both reliable and comprehensive; consequently, this approach facilitates a high degree of analytical precision by eliminating the risks of secondary data degradation.
- We tracked the correlation of ‘For’ and ‘Against’ votes relative to ISS and Glass Lewis guidance, omitting ‘Abstain’ votes from the scope. Abstentions represent a marginal fraction of the total—never exceeding a 0.01% threshold of votes cast—and are frequently non-existent among the investors in our study.To establish peer groups comparable between the UK and Germany, we opted for the FTSE 100 on the one side, and we aggregated the DAX 40 and MDAX 50 to create a synthetic DAX 90.
- By utilizing this synthetic index, we not only achieved a highly balanced sample sizes for our analysis but also concentrated on the German side to large-cap and mid-cap companies, which better reflects the set-up of the FTSE 100.
- To ensure a consistent baseline for voting guidelines and investor expectations, we excluded companies without full proxy coverage—typically, though not exclusively, due to insufficient free float.
- We also excluded companies incorporated outside the target market to ensure a consistent comparison, as foreign entities may be subject to different regulatory expectations and voting guidelines.
- In total, the analysis covers 167 companies: 85 FTSE 100 companies with 24,535 agenda items (55.8% of total votes) and 82 DAX 90 companies with 19,414 agenda items (44.2% of total votes).
Alliance Advisors Team
At Alliance Advisors, we support our EMEA-clients on each assignment with a dedicated global team that consists of:


Photo by AlphaTradeZone